# Data Studio Custom Visualizations using React
[Google Data Studio](https://developers.google.com/datastudio) is pretty easy to use for simple analytics dashboarding. Its standard visualization components are pretty comprehensive for most of the simple problems I try to solve. When you want to do something more complex, you can build custom visualizations with HTML or SVG using [Community Visualizations](https://developers.google.com/datastudio/visualization) .
The [documentation](https://developers.google.com/datastudio/visualization/write-viz) for writing visualizations is great, but the examples involve direct DOM manipulation:
```javascript
var chartElement = document.createElement('div');
chartElement.id = 'myViz';
document.body.appendChild(chartElement);
```
I recently worked on a complex visualization for a test flakiness dashboard, and found it convenient to use [React](https://reactjs.org) and [JSX](https://reactjs.org/docs/introducing-jsx.html) instead of hand crafting DOM nodes. In this post, I'll develop a simple community visualization that uses React. In a later blog, I'll expand this example to show how it can populate with a datasource from Data Studio.
You can find the code for this example over on [brianduff/datastudio-react](https://github.com/brianduff/datastudio-react) on GitHub.
## Setting up
I'm going to use TypeScript, but you can use plain old JavaScript if you want.
```bash
npm init -y
# Install the DSCC library and react
npm install @google/dscc react react-dom
npm install --save-dev @types/react @types/react-dom
# Install and initialize TypeScript (optional)
npm install --save-dev typescript
npx tsc init
```
Among the things this generates is the `tsconfig.json` file. We'll make a few minor changes to it. Here's the complete file:
```json
// TODO: more stuff to add here.
{
"compilerOptions": {
"target": "es2016",
"module": "commonjs",
"esModuleInterop": true,
"forceConsistentCasingInFileNames": true,
"strict": true,
"skipLibCheck": true,
// Enable jsx
"jsx": "react-jsx",
// Send output to a different folder
"outDir": "built-tsc"
},
// Tell tsc to find our code in a folder called src.
"include": ["src"]
}
```
## Create the visualization
Let's create a really simple visualization component to get started in `src/Hello.tsx`:
```jsx
export function Hello() {
return Hello!
}
```
Now, we'll create the entry point that integrates with Data Studio's DSCC library to embed our component in `src/index.tsc`. There's a bit of unavoidable DOM nastiness here, but it's confined this one place.
```jsx
import { ObjectFormat, objectTransform, subscribeToData } from '@google/dscc'
import { Hello } from './Hello'
import ReactDOM from 'react-dom'
export function drawViz(data: ObjectFormat) {
// Insert or replace the visualization element
let element = document.getElementById('viz')
if (element) {
element.parentNode?.removeChild(element)
}
element = document.createElement('div')
element.setAttribute("id", "viz")
document.body.appendChild(element)
// Actually render our component
ReactDOM.render(, element)
}
// Connect our drawViz function to Data Studio
subscribeToData(drawViz, { transform: objectTransform })
```
At this point, we can check that the code compiles using `npx tsc`. It should emit a `built-tsc` folder containing JavaScript versions of the above code.
## Bundling with webpack
In order to actually deploy the visualization, Data Studio needs it to be bundled up into a self-contained single JavaScript file along with all of its dependencies. For us, this includes the react and jsx runtimes as well as the DSCC library itself. [Webpack](https://webpack.js.org/) is designed exactly for this kind of usecase, so we'll use it here.
Let's install webpack:
```bash
npm install --save-dev webpack webpack-cli
```
Then, we'll create a simple webpack config file in `webpack.config.js`:
```javascript
const path = require('path')
const isProduction = process.env.NODE_ENV == 'production'
const config = {
entry: './built-tsc/index.js',
output: {
path: path.resolve(__dirname, 'dist'),
filename: 'viz.js',
}
}
module.exports = () => {
config.mode = isProduction ? "production" : "development"
return config
}
```
We can now generate a single `dist/viz.js` containing the visualization and its dependencies:
```bash
npx webpack
```
## Writing the manifest and config
When we deploy custom components for Data Studio, we can actually deploy a set of components in a library. We describe the whole set of components in a [manifest](https://developers.google.com/datastudio/visualization/manifest-reference) file, and each individual component includes a [config](https://developers.google.com/datastudio/visualization/config-reference) file. Let's go ahead and create these config files for our component.
`manifest.json` describes our whole "library" of components. We'll come back to `BUCKETNAME` and what it means later.
```json
{
"name": "Example Visualizations",
"organization": "Brian Duff",
"description": "Example visualizations using React and JSX",
"logoUrl": "https://img.icons8.com/dotty/80/000000/view-file.png",
"packageUrl": "https://duff.blog",
"supportUrl": "https://duff.blog",
"components": [
{
"id": "hello",
"name": "Hello",
"description": "Just says hello",
"iconUrl": "https://img.icons8.com/material/24/000000/hello.png",
"resource": {
"js": "gs://BUCKETNAME/hello/viz.js",
"config": "gs://BUCKETNAME/hello/hello.config.json"
}
}
]
}
```
And `hello.config.json` describes this simple component we've created. For now, we'll create a config with a simple dimension. We'll customize this in later blog posts.
```json
{
"data": [
{
"id": "data",
"label": "Data",
"elements": [
{
"id": "someDimension",
"label": "A Dimension",
"type": "DIMENSION"
}
]
}
]
}
```
## Deploying to Google Cloud Storage
Data Studio loads custom components from [Google Cloud Storage](https://cloud.google.com/storage). To deploy our custom component, we must upload the `manifest.json`, `vis.js`, and `hello.config.json` files to a Cloud Storage bucket. Create a new bucket following the instructions in [Creating a storage bucket](https://cloud.google.com/storage/docs/creating-buckets), and make a note of your bucket name. You'll want to modify `manifest.json` to replace `BUCKETNAME` with the actual name of the bucket you created.
After that, you can upload using the `gsutil` command, which you should have installed as part of the bucket creation instructions.
First, you'll want to change the ACLs of the bucket so that they allow public access. New buckets in GCS are created with uniform bucket-level access, which means you can't set permissions for individual files in the bucket (or the bucket itself), and are not visible to public by default. The instructions for Data Studio haven't been updated yet to account for this; the `-a public-read` option to `gsutil cp` won't work. Let's go ahead and make our new bucket visible to the public (replace BUCKETNAME with the name of your bucket):
```bash
gsutil iam ch allUsers:objectViewer gs://BUCKETNAME
```
Now, let's organize our files the way we want to upload them:
```bash
mkdir -p deploy/hello && \
cp manifest.json deploy/ && \
cp dist/viz.js deploy/hello/ && \
cp hello.config.json deploy/hello/
```
After that, we can copy the files up to GCS like so:
```bash
gsutil cp -r deploy/* gs://BUCKETNAME
```
## Trying it out
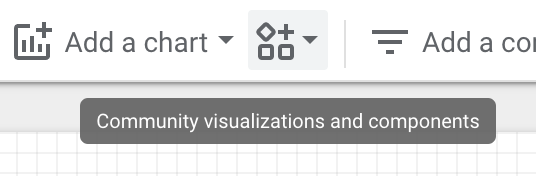
We should be able to try the component out in Data Studio now. Go over to https://datastudio.google.com and create a new blank report. Add a data source to your report (it can just be a Google Sheet). Click on the Community Visualizations and Components toolbar button:
Click "+ Explore More", then click the "Build your own visualization" button in the Community Gallery. In the Manifest path, type the bucket URL of your manifest:
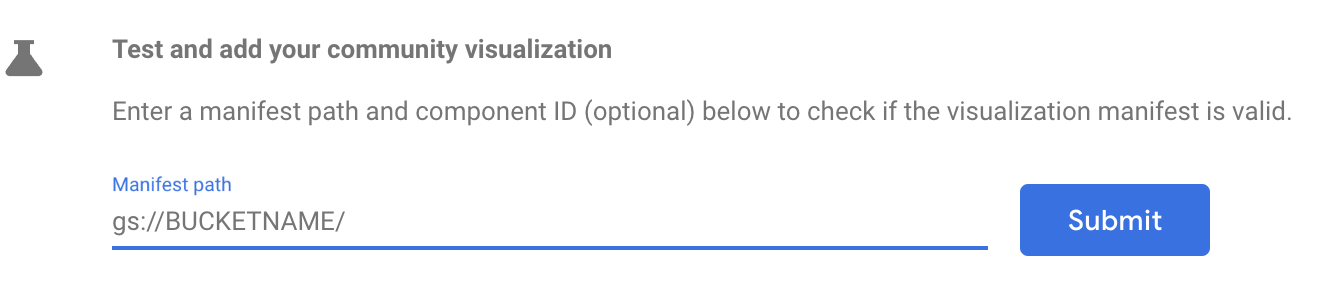
Note here, that you're entering the bucket path (i.e. `gs://BUCKETNAME`), **not** the path of the actual manifest.json file within it (e.g. `gs://BUCKETNAME/manifest.json`). This tripped me up when I first tried this out, and the error message is quite opaque.
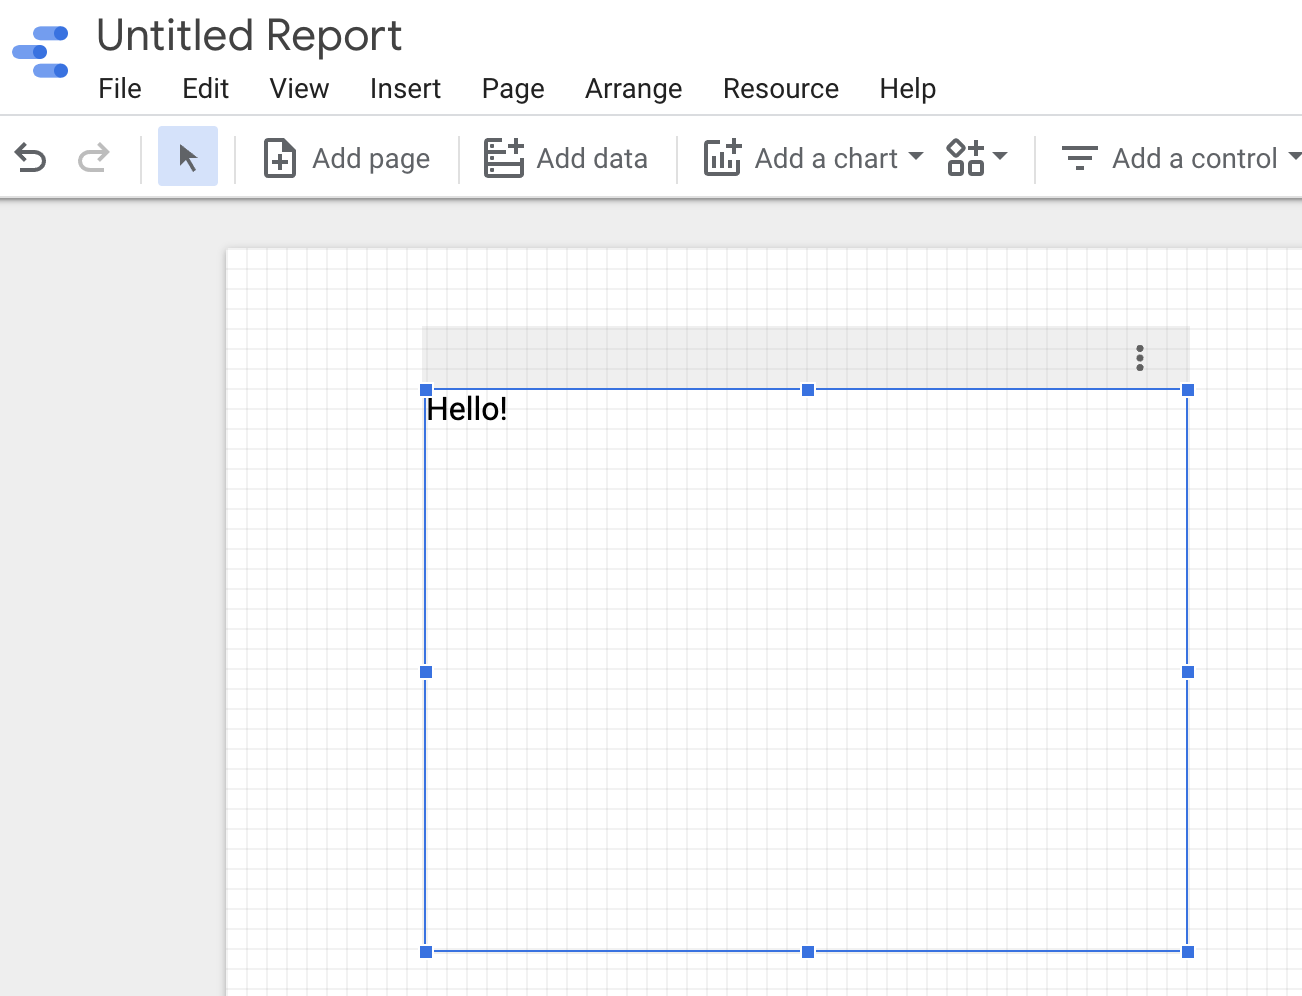
Click on the Hello component and grant it permission, and you should see it render in your report:
## Scripts to make life easier
Let's make things a bit easier for future development by adding some scripts to `package.json`. In the scripts section of this file, we'll add the following:
```json
"scripts": {
"build": "npx tsc",
"prepare": "mkdir -p deploy/hello && cp manifest.json deploy/ && cp dist/viz.js deploy/hello/ && cp hello.config.json deploy/hello/",
"deploy": "npm run build && npm run prepare && gsutil cp -r deploy/* gs://BUCKETNAME"
},
```
Now we can build and deploy in one step with `npm run deploy`.
## Wrapping up
Phew, that was a lot for a glorified Hello World :P However, now it's pretty easy to write quite complex custom visualization components using react that work well with Data Studio. In future blogs, I'll explore more of what you can do.
The code for this simple project might serve as a good starting point for your own visualizations. You can grab the code at [brianduff/datastudio-react](https://github.com/brianduff/datastudio-react), and let me know in the comments if you run into any issues or have questions!